

A Quick Guide to Analyzing Microsoft SQL Server Execution Plan
Analyze an execution plan to enhance query performance through operator understanding, execution order, and practical analysis steps.

Microsoft SQL Server is a powerful and widely used relational database management system that efficiently stores and retrieves data for various applications. One of the critical aspects of optimizing the performance of SQL queries is understanding and analyzing the execution plan generated by the SQL Server query optimizer. An execution plan is a detailed blueprint of how the database engine intends to execute a given query. By deciphering and interpreting this plan, database administrators and developers can identify performance bottlenecks and optimize query performance. In this article, we will analyze Microsoft SQL Server's execution plan.
Understanding the Execution Plan
Before diving into the analysis, it's essential to grasp the basics of an execution plan. When a query is submitted to SQL Server, the optimizer evaluates multiple ways to retrieve the requested data and chooses the most efficient path based on available indexes, statistics, and other factors. The preferred approach is represented graphically as an execution plan, which can be viewed using tools like SQL Server Management Studio (SSMS).
An execution plan consists of operators, each representing a step in the execution process. These operators are connected in a tree-like structure that illustrates the order in which the operations will be performed. Understanding the meaning of different operators and their arrangement is essential for analyzing the plan effectively.
Accessing the Execution Plan
To access the execution plan in SSMS, follow these steps:
Open SSMS and connect to the desired SQL Server instance.
Open a new query window.
Write the query you want to analyze.
Select the "Include Actual Execution Plan" option located in the toolbar, or simply use the shortcut
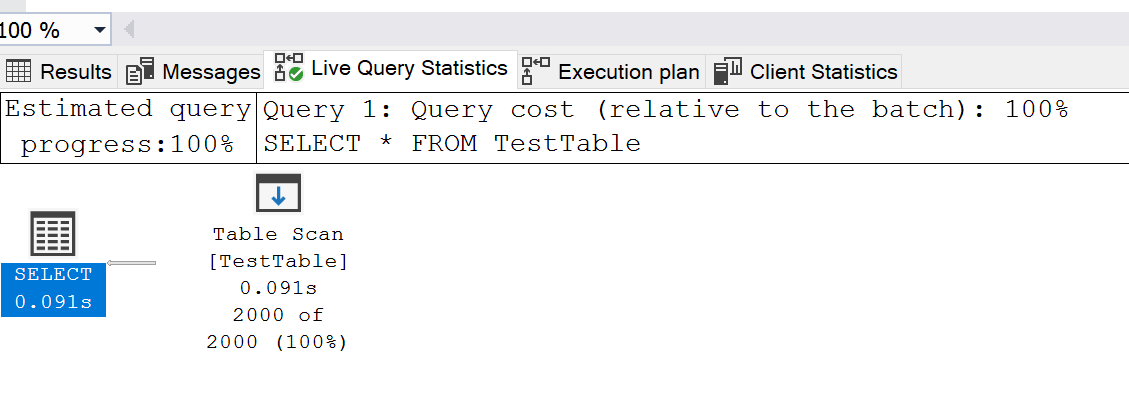
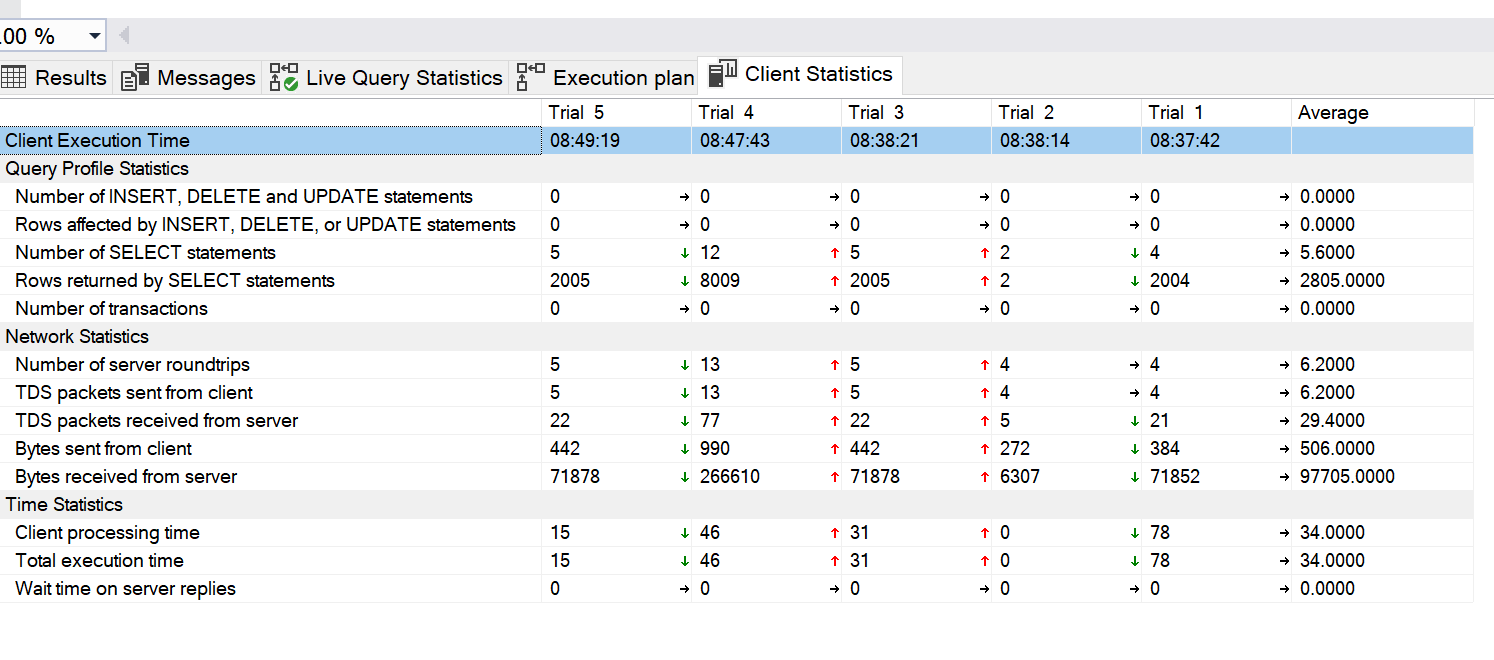
Ctrl + M. Alternatively, you can activate it from the toolbar with additional choices such as "Include Live Query Statistics" and "Include Client Statistics".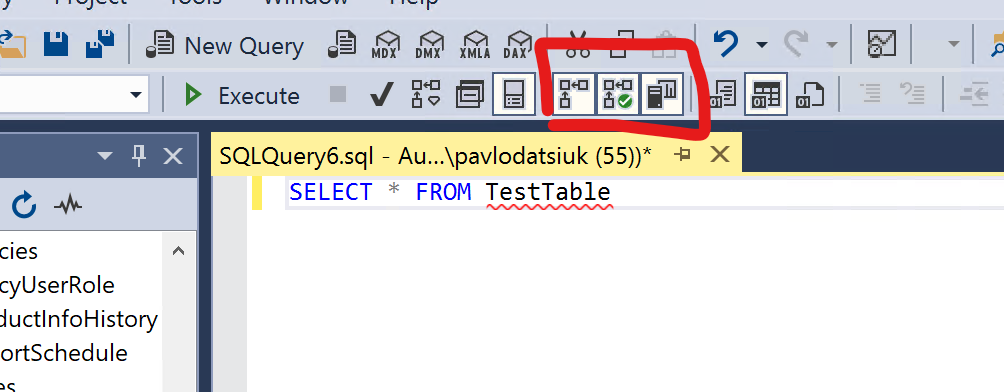
Execute the query (the shortcut is
F5).
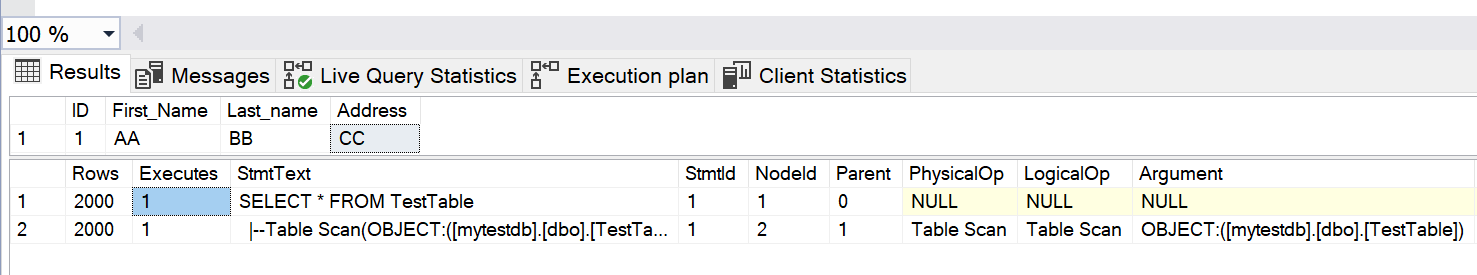
The execution plan tab will appear next to the query results. Within this tab, you will find a graphical depiction of the execution plan, along with supplementary details about the cost and attributes of each operator. Moreover, you have the option to view the plan in textual or XML format as well.
Key Elements of the Execution Plan
Operators
Operators are the fundamental building blocks of the execution plan. They represent different types of actions the database engine performs to process the query. Common operators include:
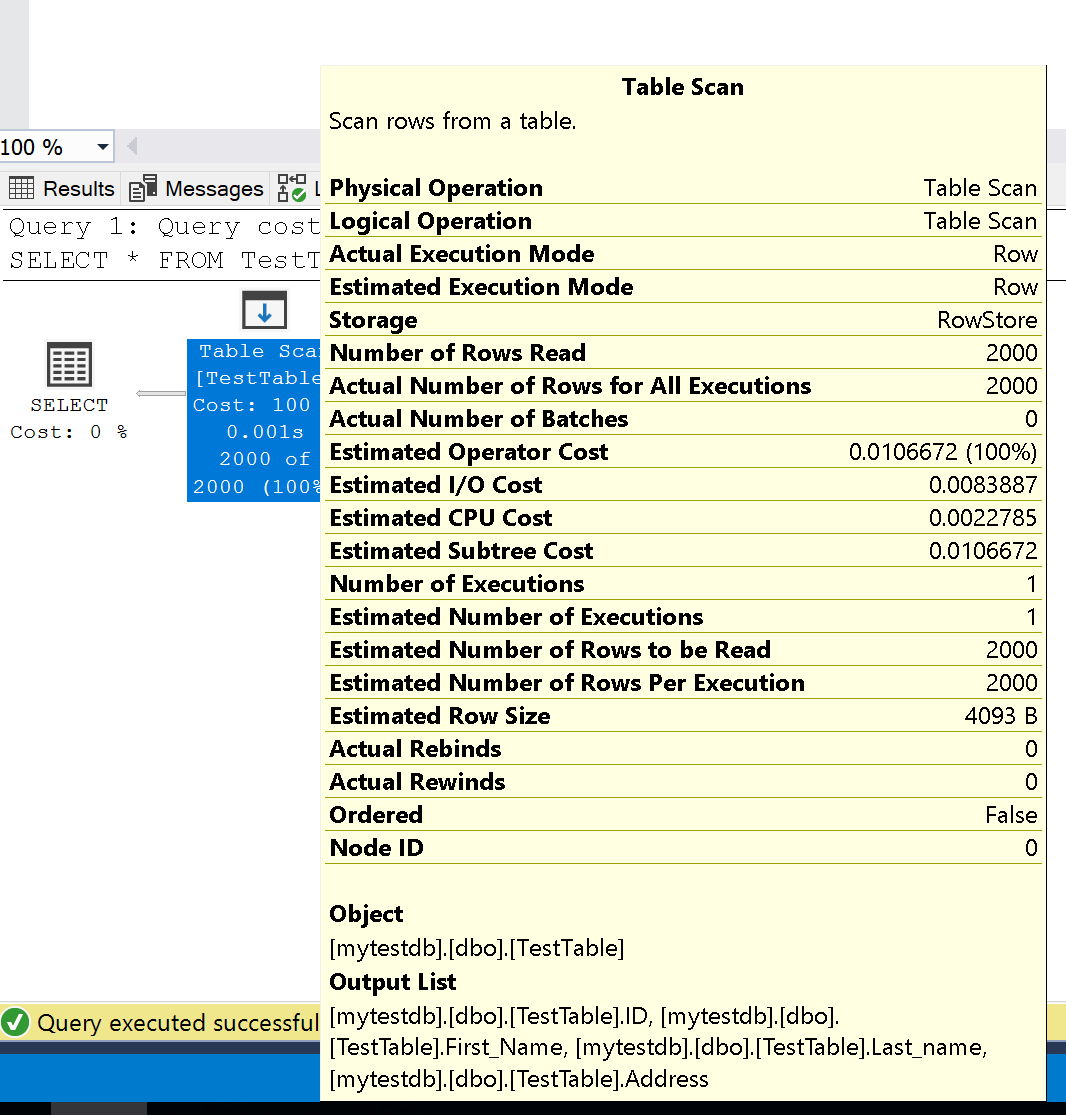
- Table Scan: Reads all rows from a table.

- Index Scan: Reads rows from an index based on search conditions.
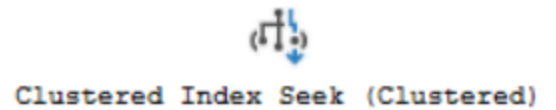
- Clustered Index Seek: Searches a clustered index for specific values.
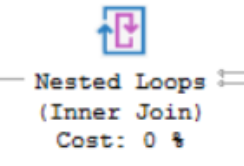
- Nested Loops Join: Combines rows from two sources using nested loops.
- Hash Match Join: Performs a join using a hash table.

- Sort: Sorts rows based on specified columns.
- And others: Here is the complete list
7. Index Seek: Searches for specific values within a non-clustered index.
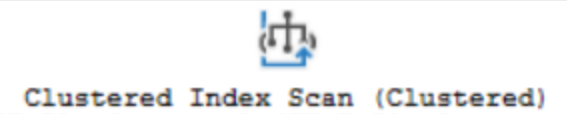
8. Clustered Index Scan: Scans the entire table or index to retrieve rows based on the query's filtering conditions.
9. RID Lookup: Retrieves additional columns from a base table using a unique identifier obtained from an index seek or scan.
10. Key Lookup: Similar to RID Lookup, but retrieves additional columns from a base table using a clustered index key.
11. Merge Join: Joins two datasets that are sorted on the join key, combining them in a single pass.
12. Filter: Applies a filtering condition to rows, eliminating those that don't meet the criteria.
13. Aggregate: Performs aggregation functions like SUM, AVG, COUNT, etc., on groups of rows.
14. Stream Aggregate: Performs aggregate functions during the data stream, typically used for small groups.
15. Compute Scalar: Performs calculations on columns and generates new values.
16. Scalar Operator: Represents simple scalar expressions.
17. Table-valued Function: Calls a user-defined function that returns a table.
18. Constant Scan: Returns a single row with constant values.
19. Table Spool: Temporarily stores the result of a subquery or part of a query.
20. Window Spool: Performs window functions, storing the result temporarily.
21. Table Insert: Inserts data into a table.
22. Table Delete: Deletes data from a table.
23. Table Update: Updates data in a table.
24. Parallelism: Divides the query into parallel threads for execution.
25. Assert: Verifies that certain conditions are met during query execution.
26. Sequence Project: Generates a sequence of values.
27. Bitmap: Performs bitmap operations for filtering and merging results.
28. Gather Streams: Gathers and combines parallel streams of data.
29. Hash Match Aggregate: Performs aggregations using a hash table.
30. Remote Query: Executes a query on a remote server.
31. Remote Scan: Scans a remote table.
Understanding the purpose of each operator is crucial for determining which parts of the query are causing performance issues.
Execution Order
The execution plan connects operators in a defined order, which dictates the sequence of operations. This order commonly adheres to a "bottom-up, right-to-left" pattern.
Estimated vs. Actual Execution Plan
The execution plan can be either "estimated" or "actual." The estimated plan is generated based on statistical information available to the query optimizer before the query is executed. The actual plan is generated after the query has been executed and provides more accurate information about the resources consumed by each operator.
To update statistics on demand, you can use the following SQL.
EXEC sp_updatestats -- for the entire database

UPDATE STATISTICS dbo.table WITH FULLSCAN, COLUMNS -- for the specific table
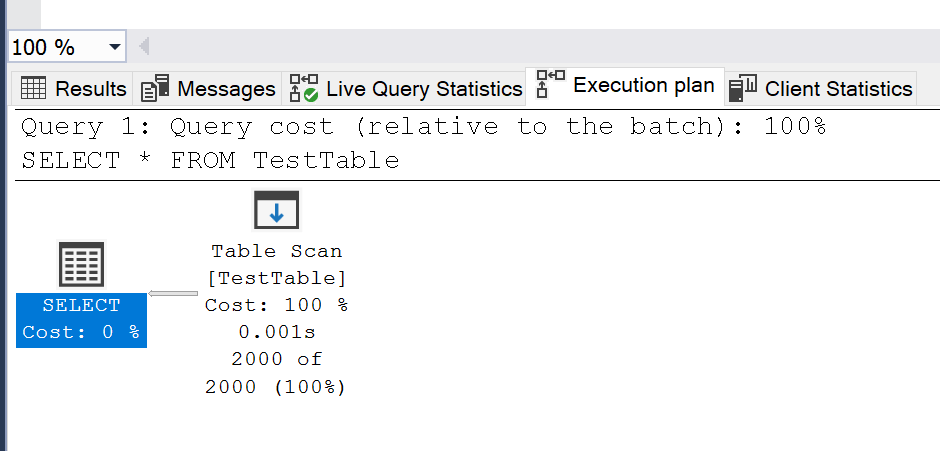
Cost
Each operator in the execution plan has an associated cost, typically measured in terms of CPU and I/O resources. The query optimizer uses these costs to decide the most efficient execution plan. Understanding the costs can help identify bottlenecks and resource-intensive operations.
Analyzing the Execution Plan
Once you have accessed the execution plan, here are some steps to guide your analysis:
Identify Expensive Operators: Look for operators with high relative costs. These are often the most resource-intensive parts of the query.
Check for Missing Indexes: The execution plan might suggest missing indexes that could improve query performance. Consider creating these indexes if they align with your overall database strategy.
Evaluate Cardinality Estimations: Compare the estimated and actual number of rows each operator processes. Significant differences can indicate outdated statistics or skewed data distributions.
Consider Join Types: Examine the join types used in the plan. Inefficient joins can lead to poor performance. Choose join types that utilize indexes effectively.
Review Predicate Use: Ensure predicates (WHERE clauses) use indexes efficiently. Inefficient predicate usage can lead to full table scans.
Watch for Implicit Conversions: Implicit data type conversions can affect performance. They might lead to index scans instead of seeks or affect join performance.
Look for Parallelism: SQL Server might use parallel execution to process parts of the query concurrently. While parallelism can improve performance, it can also lead to resource contention.
Consider Plan Reusability: Analyze whether the execution plan is reusable for similar queries. If the plan can be reused, it can save resources compared to generating a new plan for each execution.
Use Query Store: SQL Server's Query Store feature tracks query performance over time, making identifying plan regressions and query performance changes easier.
Conclusion
Analyzing Microsoft SQL Server's execution plan is crucial for database administrators and developers aiming to optimize query performance. By understanding the components of the execution plan, evaluating operators, and identifying performance bottlenecks, you can make informed decisions to enhance the efficiency of your SQL queries. Regularly reviewing execution plans and addressing any issues discovered can lead to a well-optimized and high-performing database system.


